The U.S. Misery Index
MiseryIndex.us maintains a number of charts for the historic US Misery Index including monthly misery charts, comparative misery by President as well as by Congress along with individual charts for historic unemployment, and rate of inflation respectively.
The chart below displays yearly misery, or the lack thereof, by President.
Click on the chart below to reach MiseryIndex.us.
Not quite as miserable an experience as you might think.
Blue is unemployment, Red is inflation.
The misery index was initiated by economist Arthur Okun, an adviser to President Lyndon Johnson in the 1960's. It is simply the unemployment rate added to the inflation rate. It is assumed that both a higher rate of unemployment and a worsening of inflation both create economic and social costs for a country. A combination of rising inflation and more people out of work implies a deterioration in economic performance and a rise in the misery index.
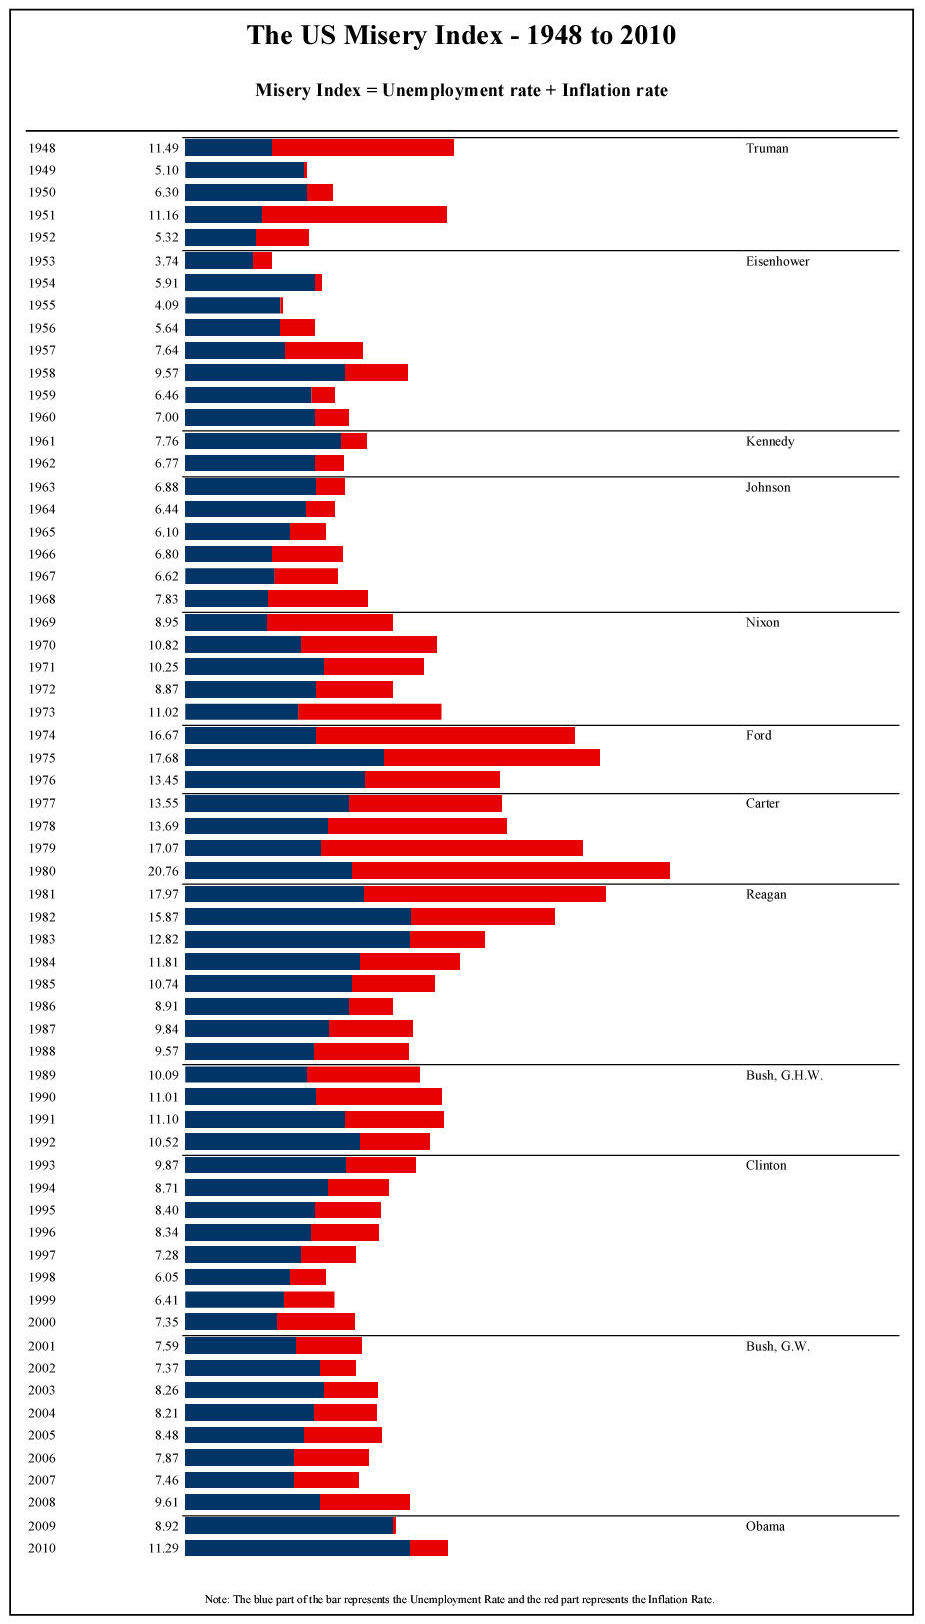
And the award for most miserable Presidency goes to ... in a landslide ... Jimmy Carter.
Which might explain why Mr. Carter is our single most miserable ex-President.
- Read more about The U.S. Misery Index
- Log in or register to post comments


![[Most Recent Quotes from www.kitco.com]](http://www.kitconet.com/charts/metals/gold/t24_au_en_usoz_2.gif)


![[Most Recent Quotes from www.kitco.com]](http://www.kitconet.com/charts/metals/silver/t24_ag_en_usoz_2.gif)