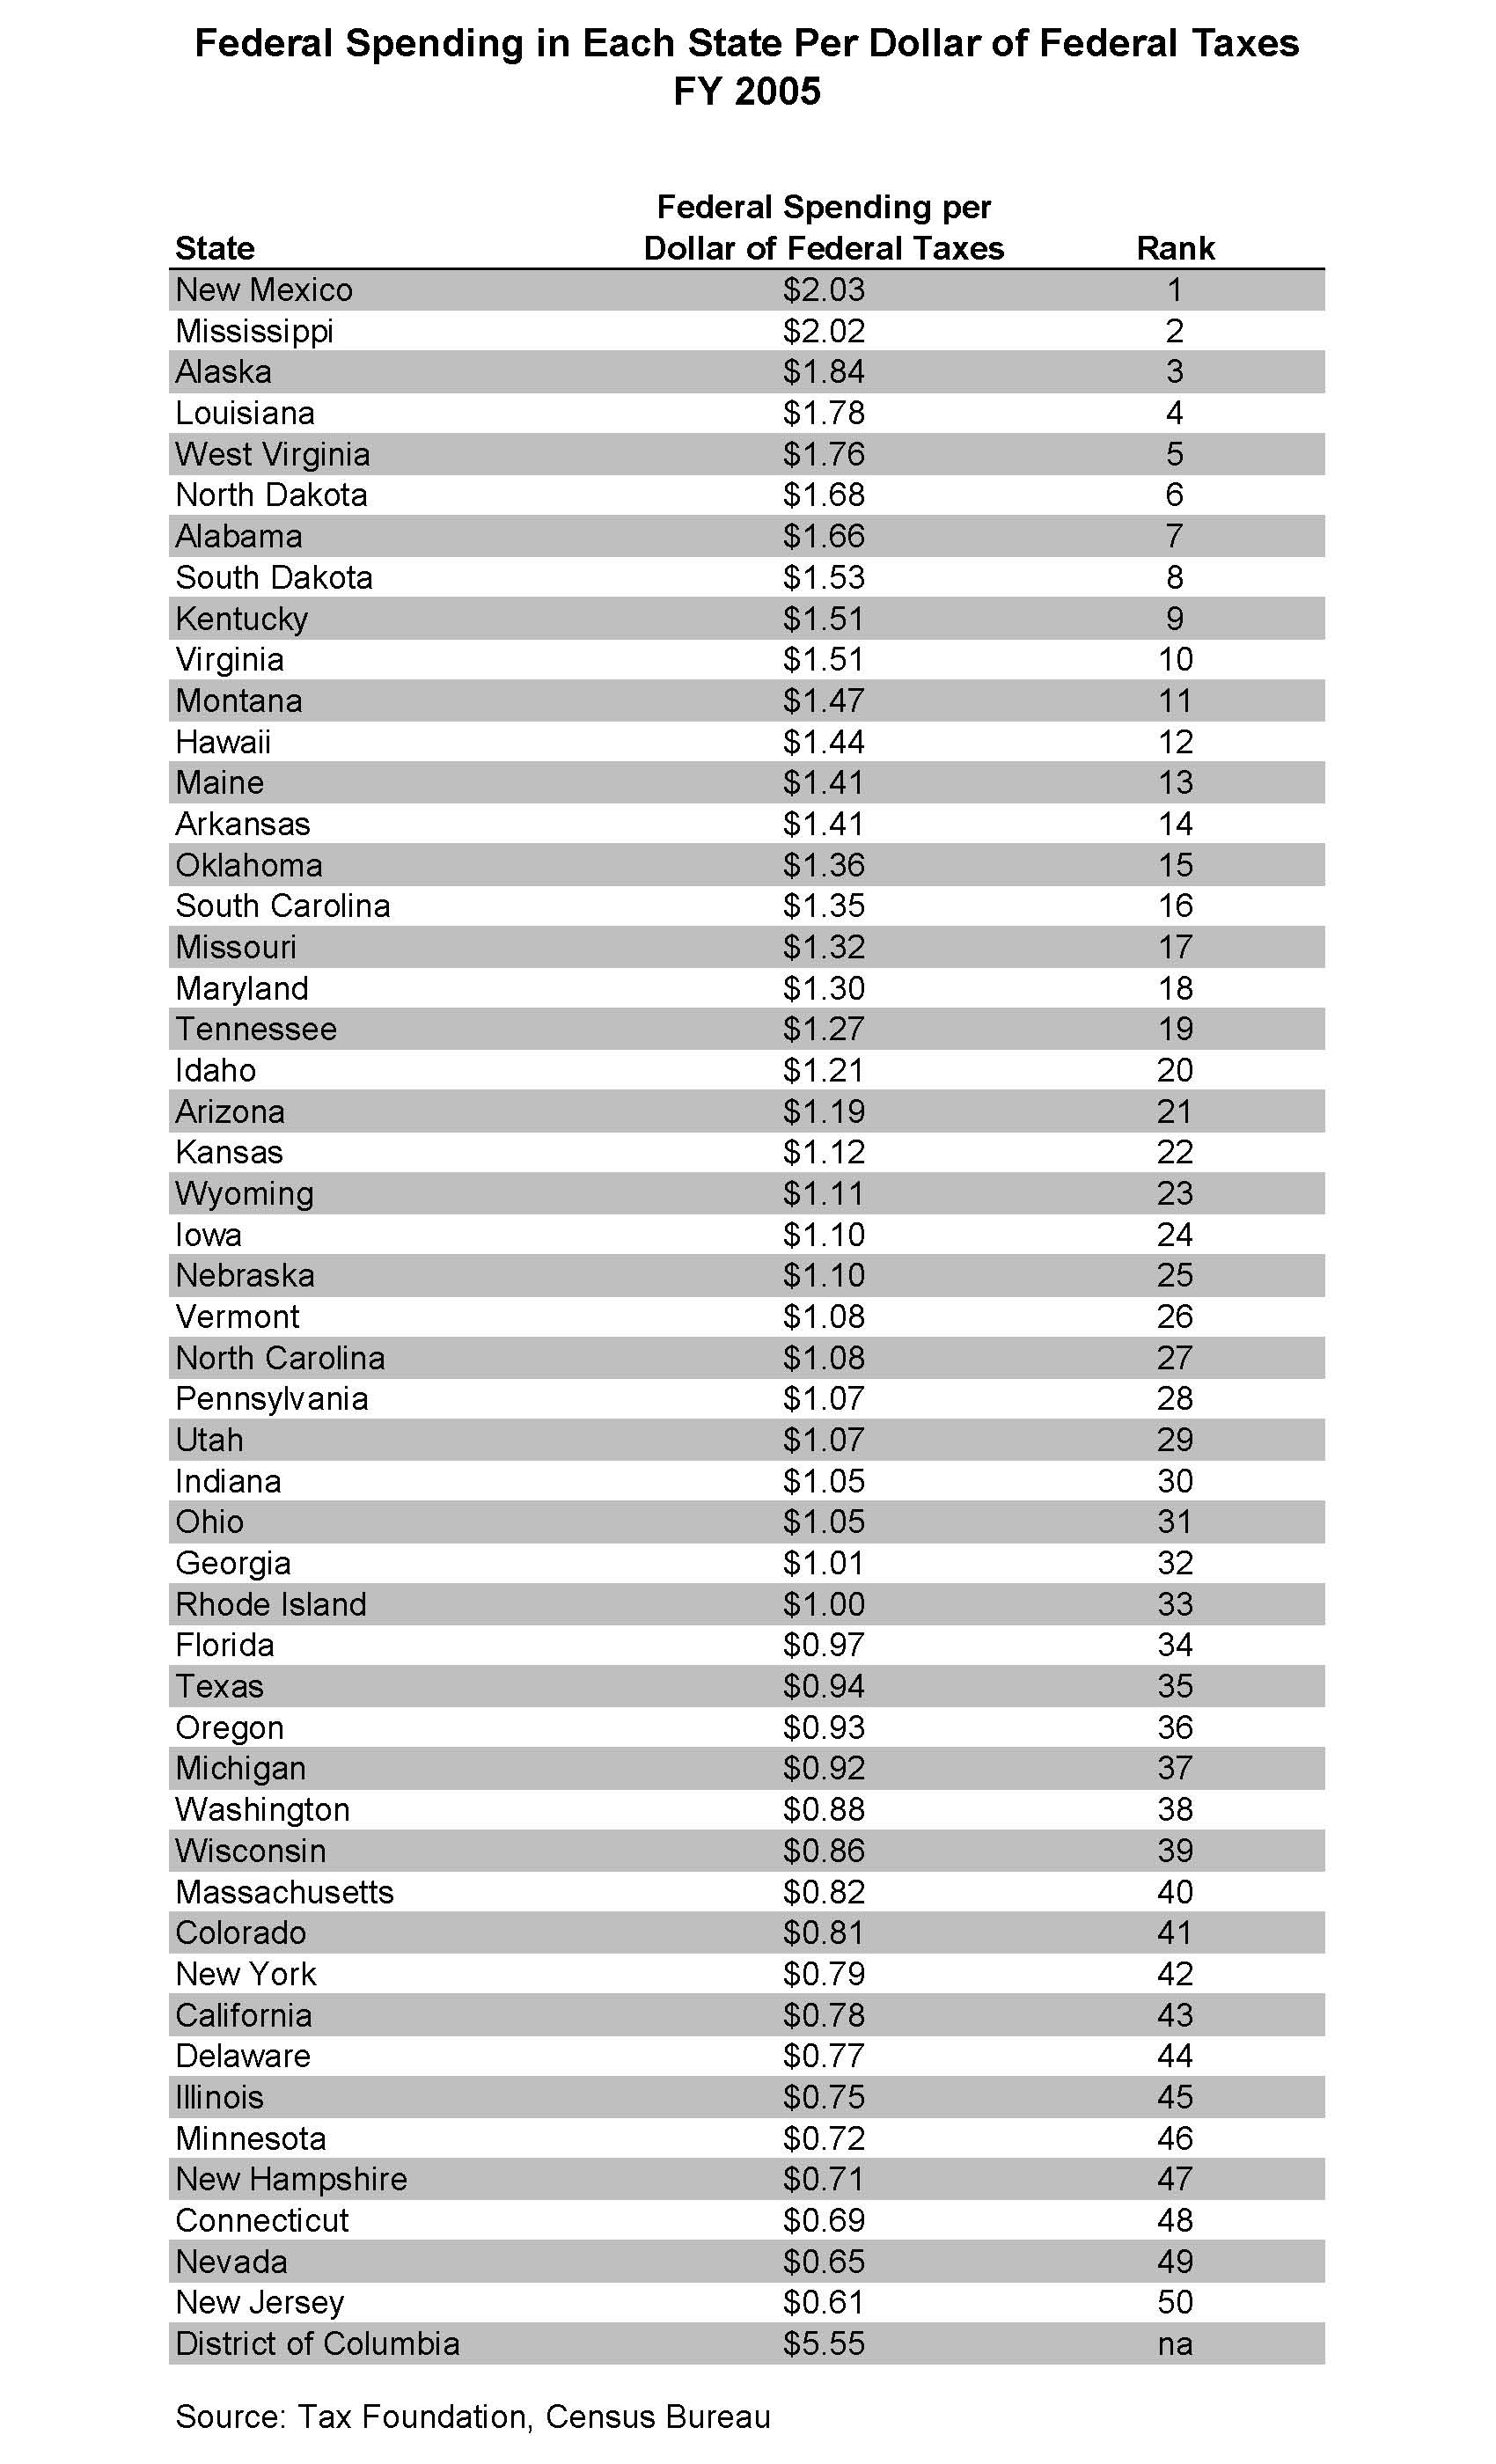
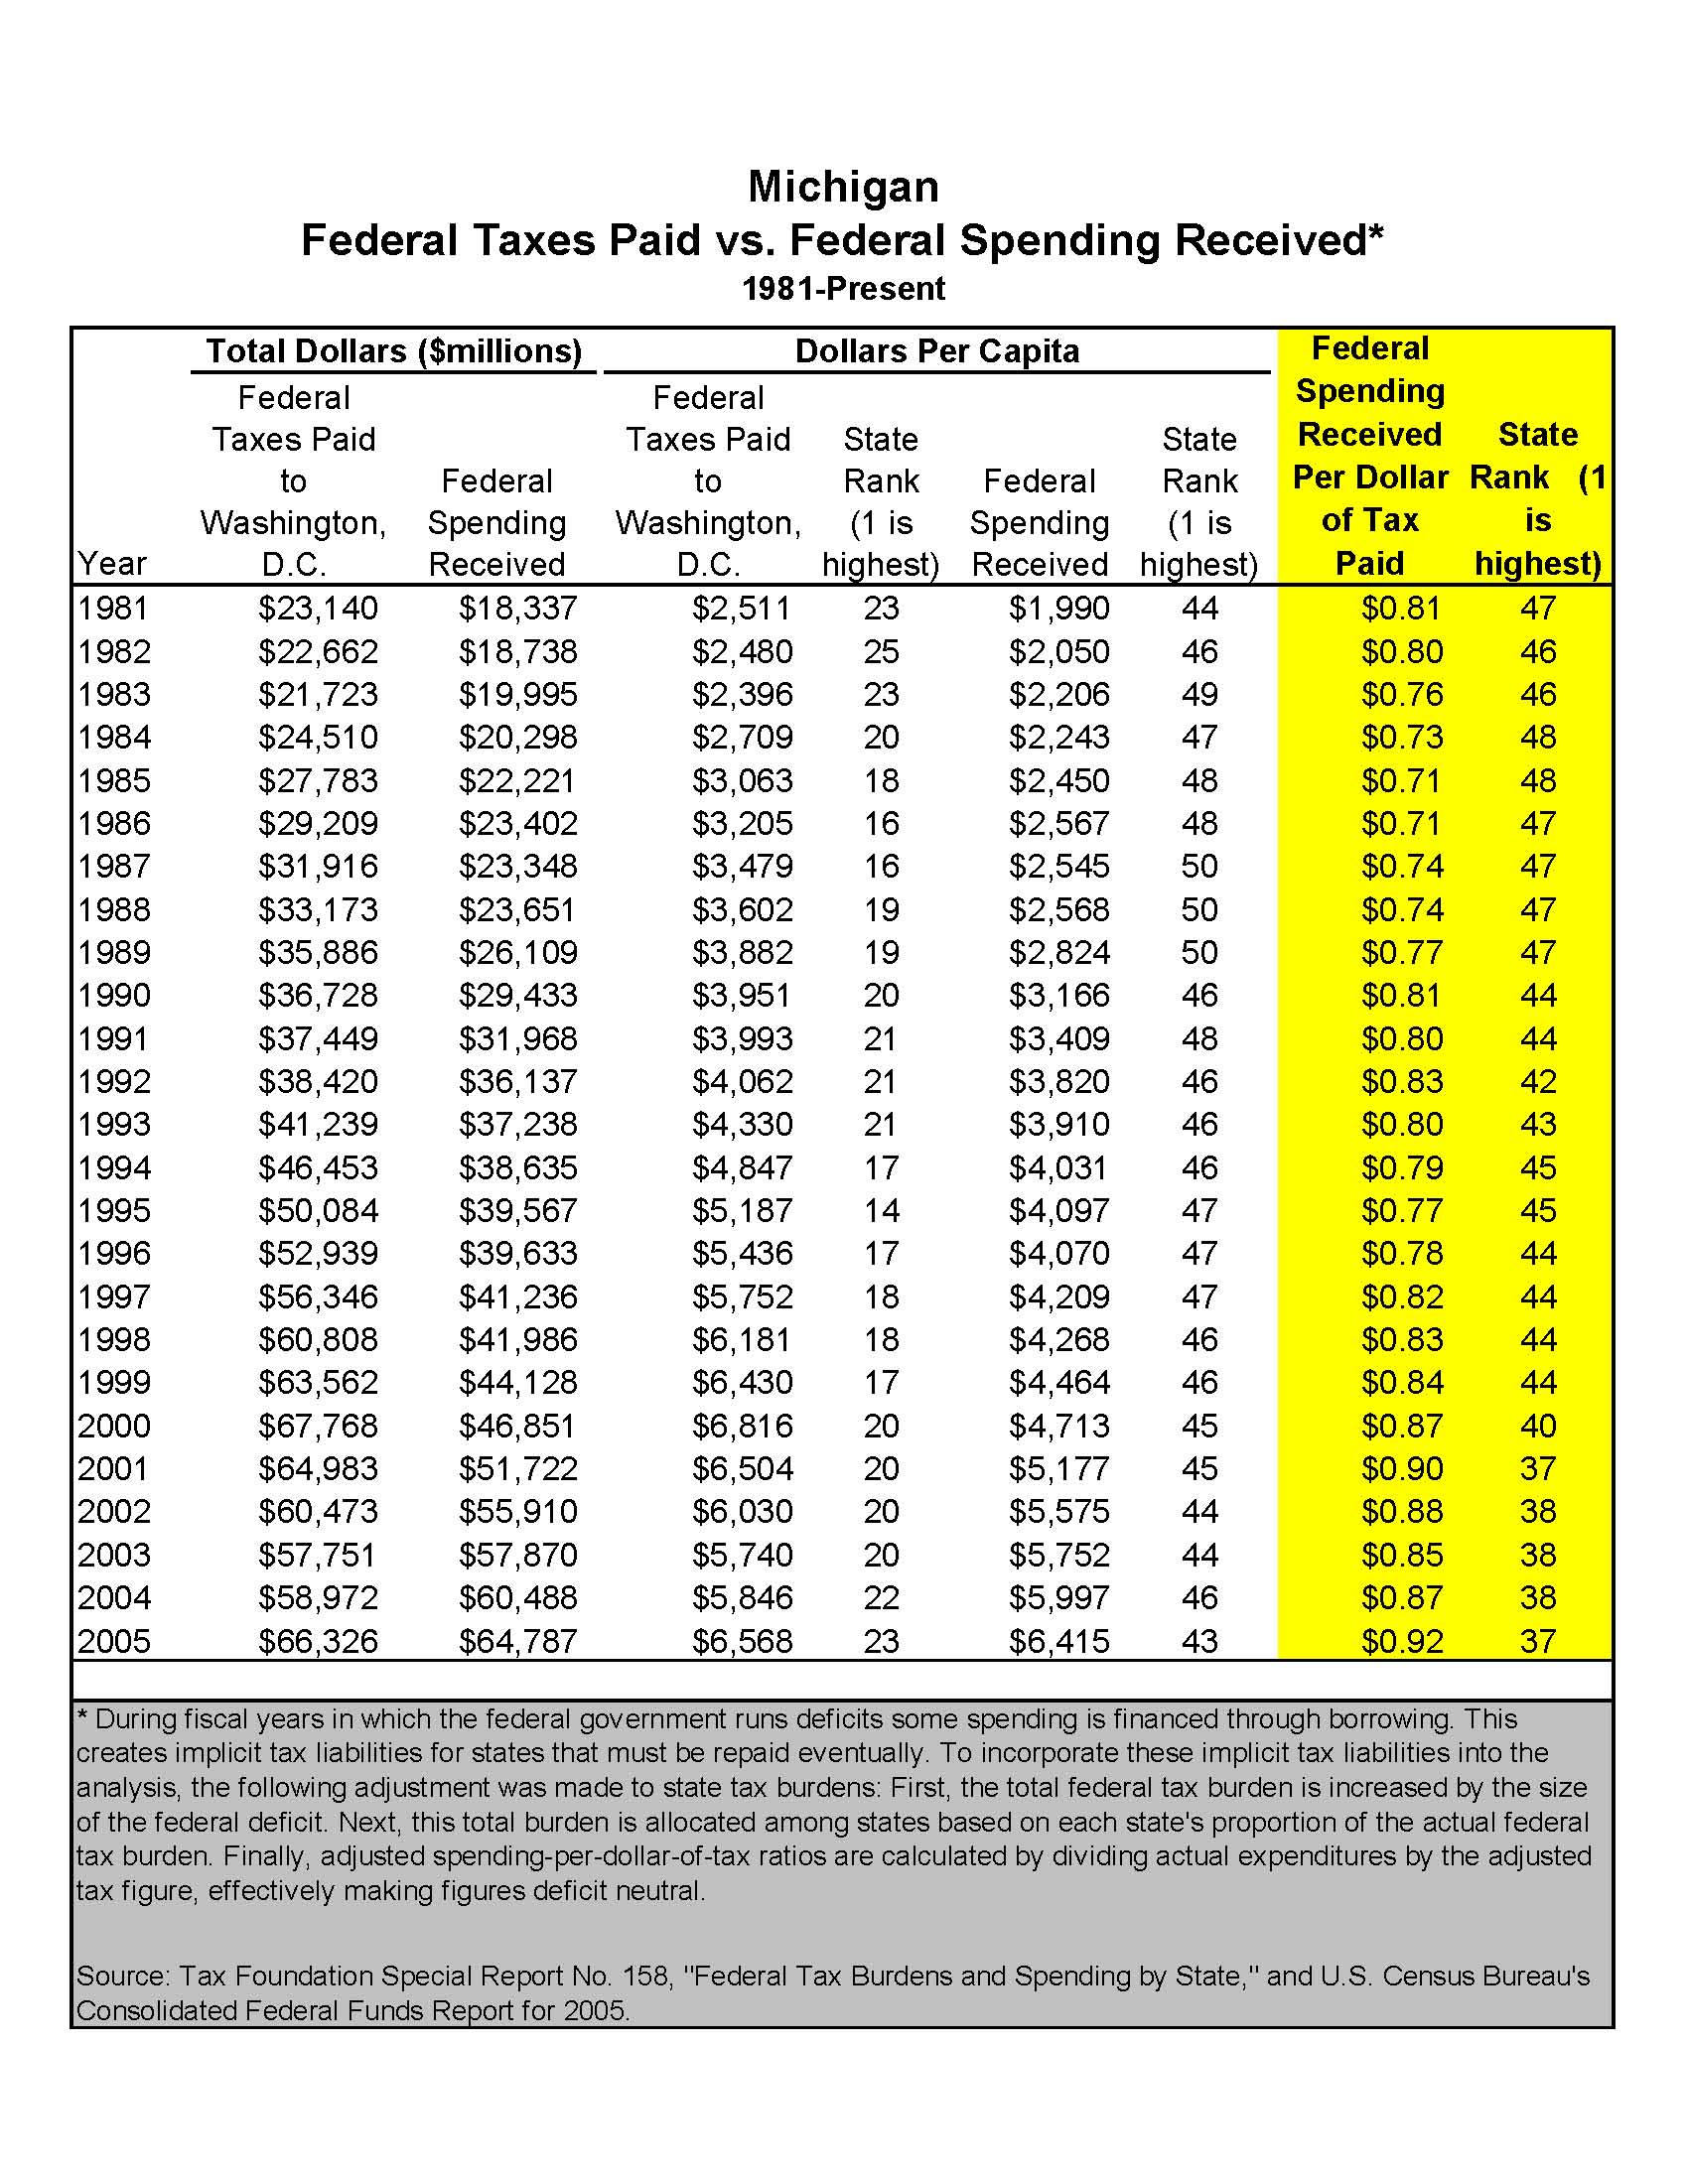
The following charts pretty much speak for themselves. Both are from the Tax Foundation and link to their fine site. 2005 is the freshest analysis that I could find. DC does good!!! Michigan? ..... Not so much! Tags: TaxesSometimes a chart is all you needJust Thinking ChronologyIRSIncome Log in or register to post comments


![[Most Recent Quotes from www.kitco.com]](http://www.kitconet.com/charts/metals/gold/t24_au_en_usoz_2.gif)


![[Most Recent Quotes from www.kitco.com]](http://www.kitconet.com/charts/metals/silver/t24_ag_en_usoz_2.gif)