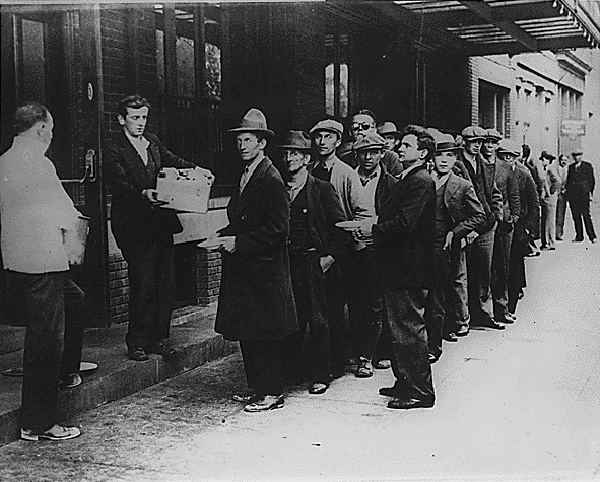
You are here

Unemployment

Unemployment

Submitted by Roanman on Sun, 02/21/2016 - 16:24


A fraction is made up of 2 numbers. The top number is called the NUMERATOR and the bottom number is called the DENOMINATOR. Inthe fraction  the 3 is the numerator and the 4 is the denominator.

DENOMINATORThis number shows how many equal 'pieces' something has been divided into. In the fraction,  the denominator is 4 which means there are 4 equal pieces that make up the whole.

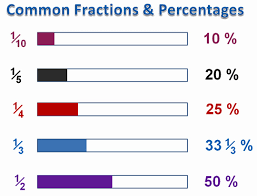
NUMERATOR: This shows how many of those pieces there are. In the fraction  there are 3 out of the total of 4 pieces.

In order to convert a fraction to a percentage, divide the top of the fraction by the bottom, multiply by 100 and add a "%" sign.

So, just for fun, in our example above 3 divided by 4 equals .75. .75 multiplied by 100 equals 75%.

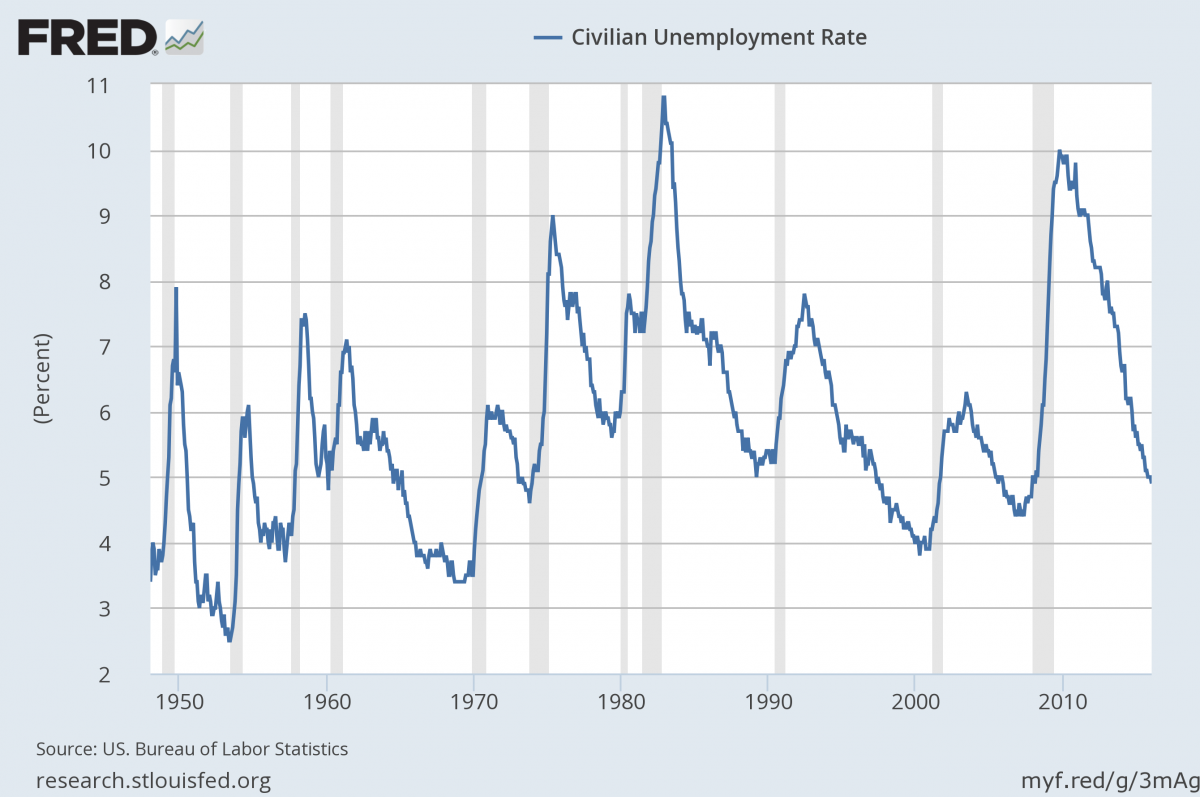
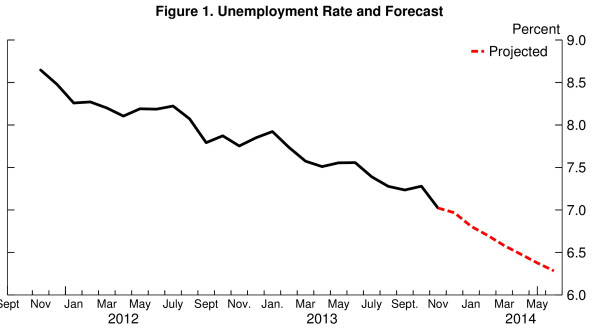
I bring this up as a preface to a discussion of the headline unemployment rate otherwise known as U3 which is presently at 4.9% according to the bureau of labor statistics.

U3 is calculated as follows, unemployment rate = number unemployed / civilian labor force x 100

So, here's an example of a calculation employing the above formula that yields a five percent unemployment rate.

unemployment rate = 5,000,000 / 100,000,000 x 100 = 5 percent

Got it? Of course you do, it's simple. But there is mischief afoot and that mischief is found in the catagory "Civilian Labor Force."

Civilian Labor Force" is defined by the Bureau of labot Statistics for purposes of this calculation as follows: All persons in the civilian noninstitutional population classified as either employed or unemployed.

Employed persons are defined for purposes of this calculation as follows: All persons who, during the reference week (week including the twelfth day of the month), (a) did any work as paid employees, worked in their own business or profession or on their own farm, or worked 15 hours or more as unpaid workers in an enterprise operated by a member of their family, or (b) were not working but who had jobs from which they were temporarily absent. Each employed person is counted only once, even if he or she holds more than one job. 


Unemployed persons are defined for purposes of this calculation as follows : All persons who had no employment during the reference week, were available for work, except for temporary illness, and had made specific efforts to find employment some time during the 4 week-period ending with the reference week. Persons who were waiting to be recalled to a job from which they had been laid off need not have been looking for work to be classified as unemployed. 


Lets go back up to our example above: unemployment rate = 5,000,000 / 100,000,000 x 100 = 5 percent unemployed.


Only let's suppose that we have only 75,000,000 in "Civilian Labor Force rather than the 100 million in the above example.

The calculation now looks like this, unemployment rate = 5,000,000 / 75,000,000 x 100 = 6.7 percent unemployed.


Let's say we have unly 60 million people in the labor force. The calculation now looks like this, unemployment rate = 5,000,000 / 60,000,000 x 100 = 8.3 percent unemployed.


It's easy to see here how increasing the numerator, in this case the number of people within the "Civilian Labor Force" reduces the unemployment rate without adding a single job.


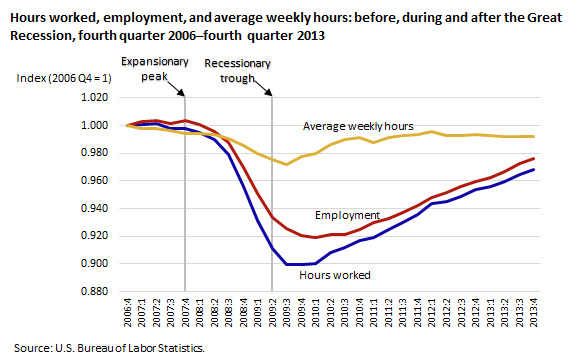
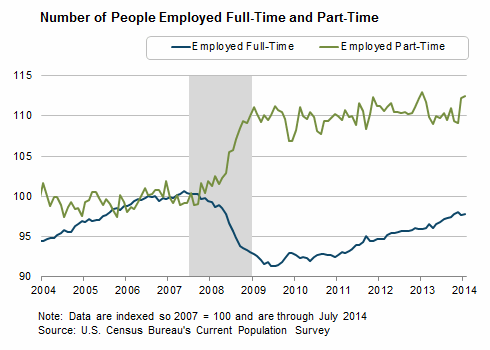
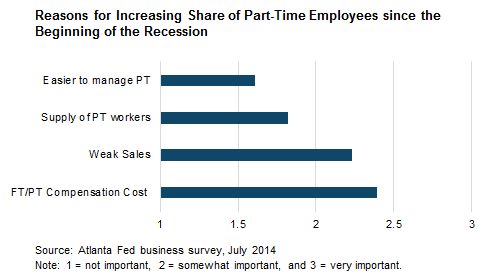
How do you increase the numerator? It's pretty simple really. Let's say an employer decides, for any reason whatsover, that rather than employing one, fulltime, 40 hour a week employee, he would prefer to have two, 20 hour a week, part time employees. Presto, for purposes of this calculation you now have two employed people where before you only had one despite the fact that the total hours worked and subsequently compensated for hasn't change at all.


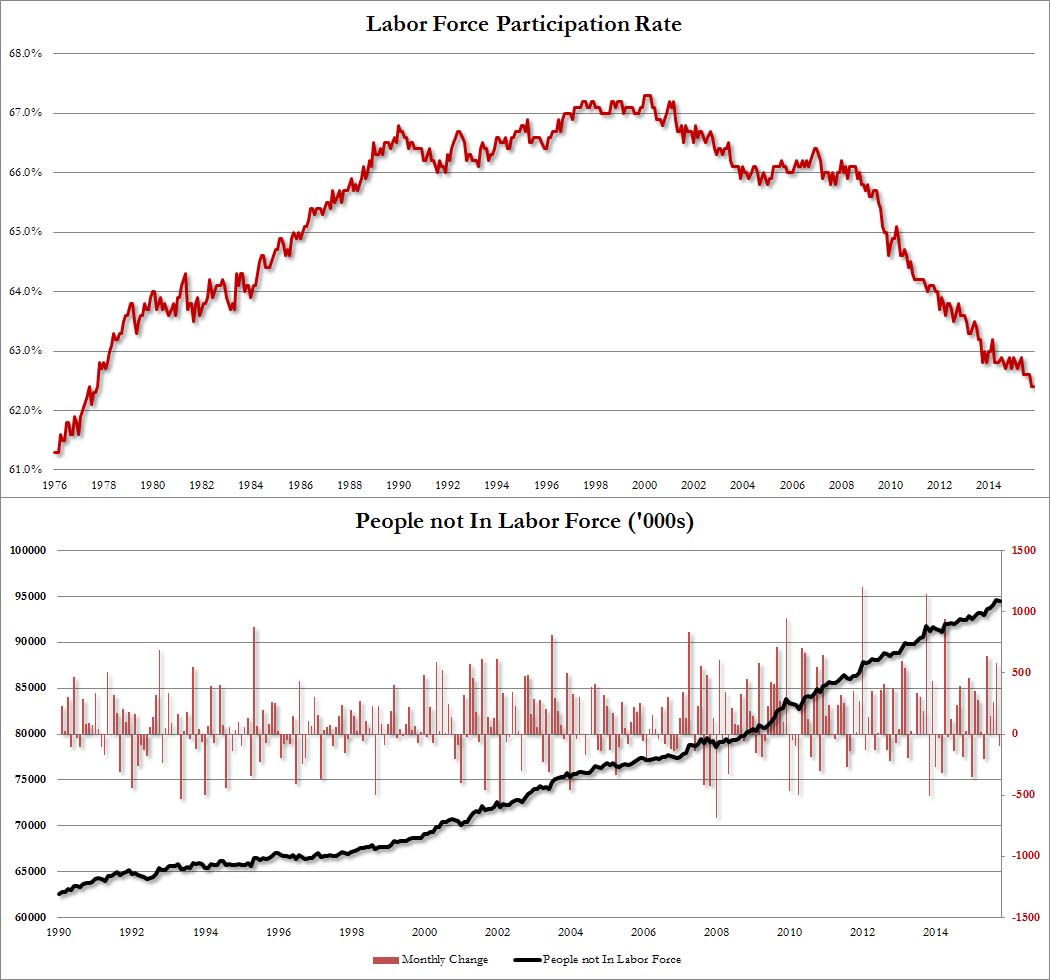
Lets take a look at the denominator or the number of people unemployed. The definition for "Unemployed Worker" requires that person to have actively looked for a job in the preceeding four weeks. If you stop looking, you no longer count within the calculation.


So again using our example above, unemployment rate = 5,000,000 / 100,000,000 x 100 = 5 percent, lets say 1 million unemployed people, for any reason, stopped looking for work last month. they no longer count as unemployed, so the calculation becomes as follows, unemployment rate = 4,000,000 / 99,000,000 x 100 = 4.04 percent.


You have to take that million people who stopped looking for a job from both the numerator and the denominator in order to make the defined calculation, but by virtue of the nature of division, the result is profound. You knock nearly 1% of the unemployment rate.


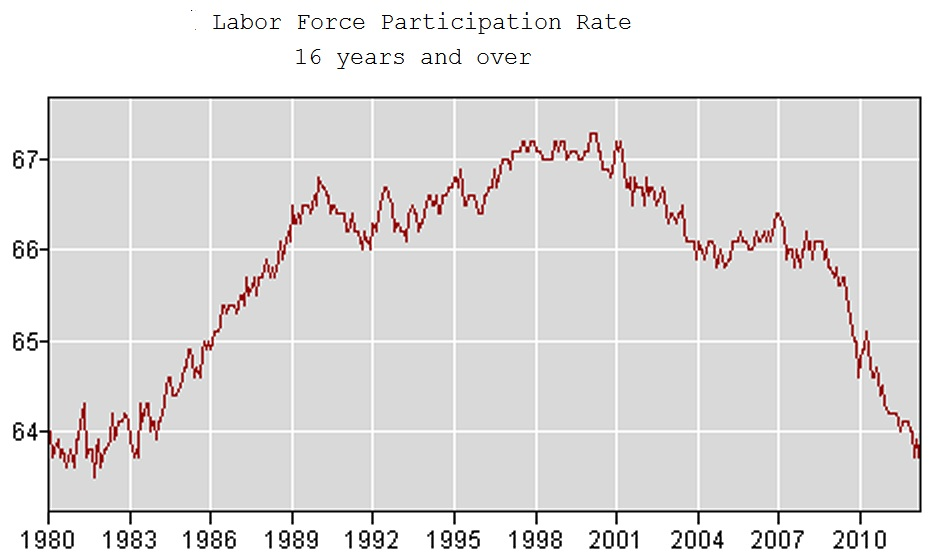
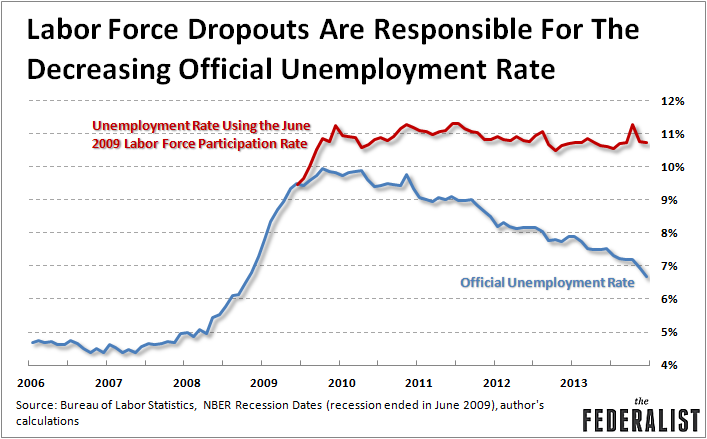
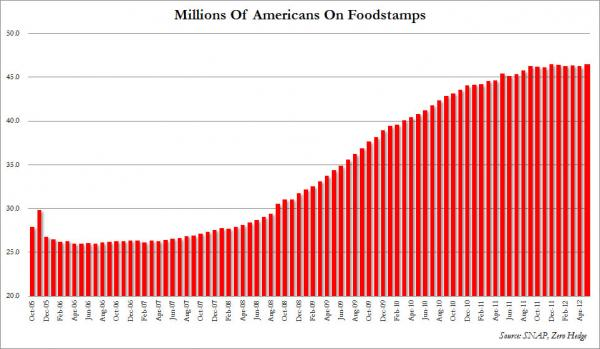
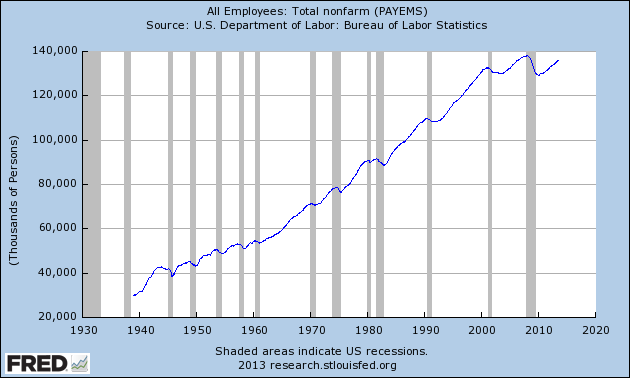
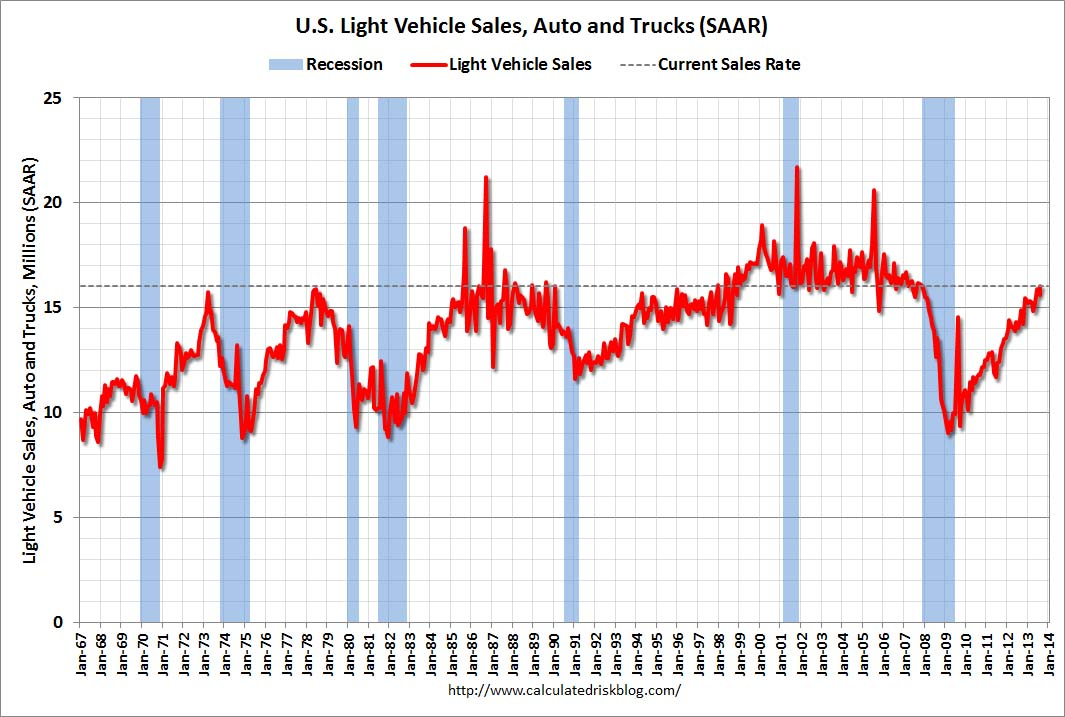
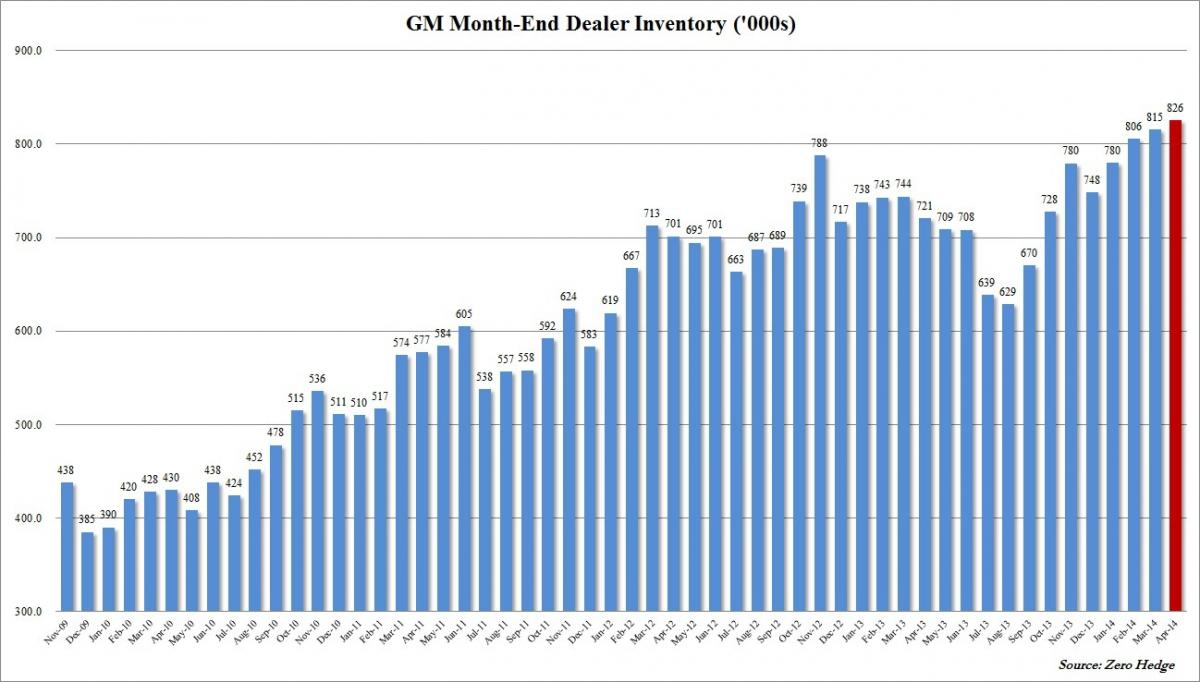
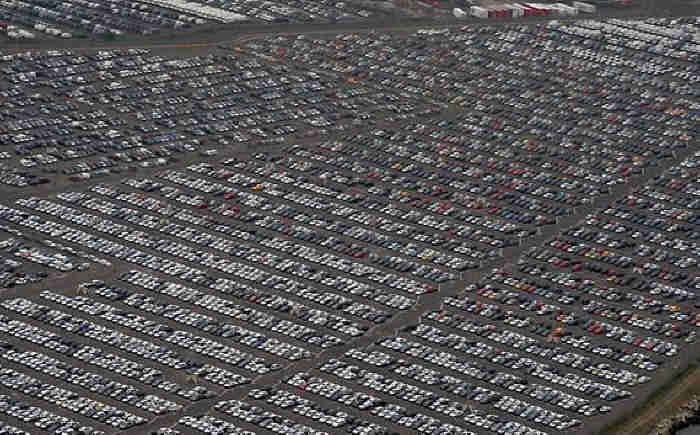
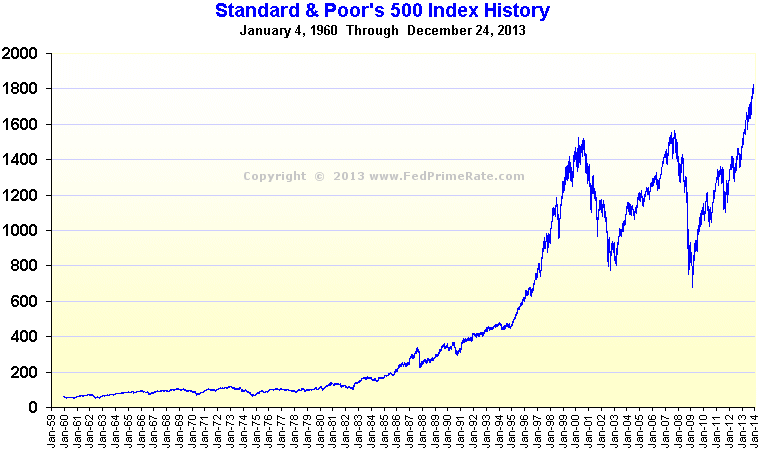
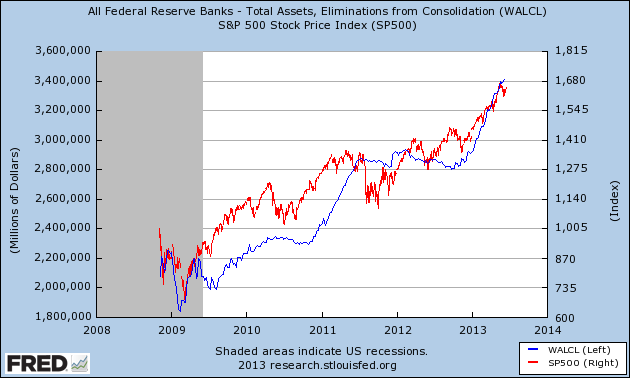
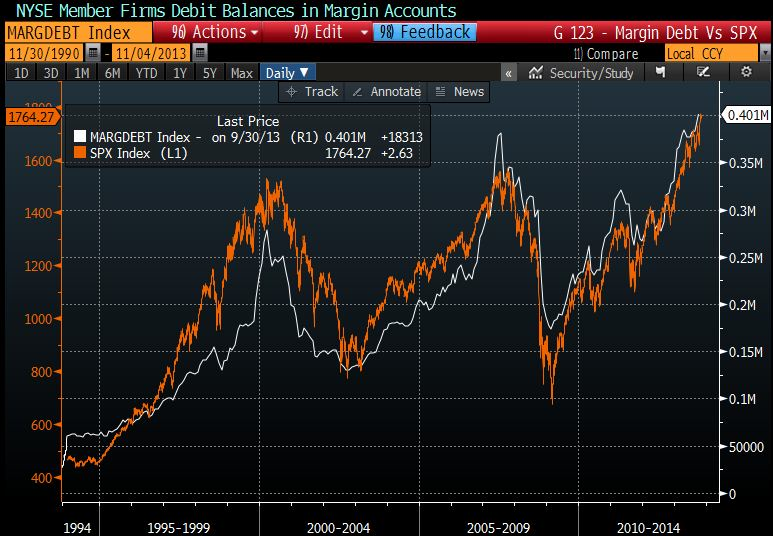
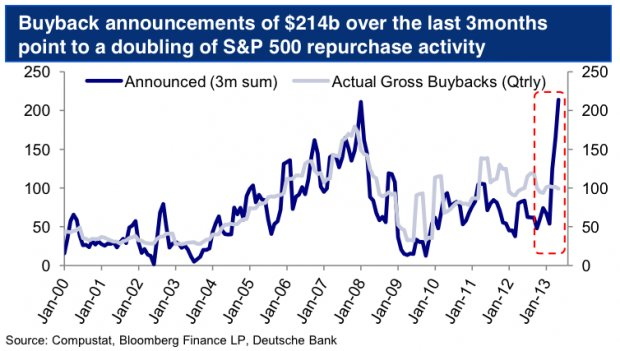
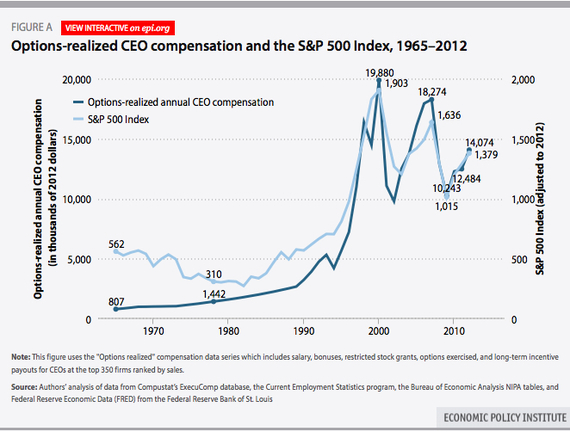
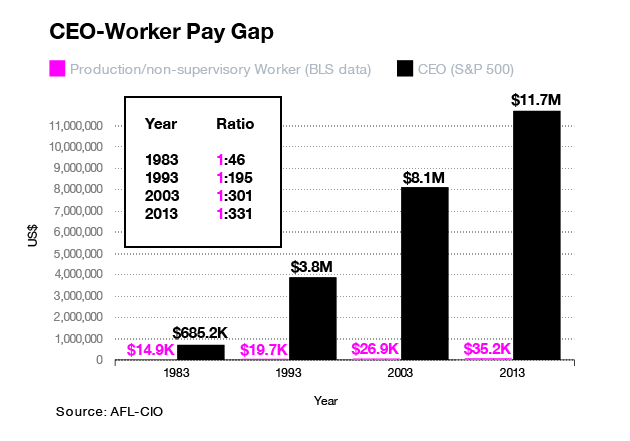
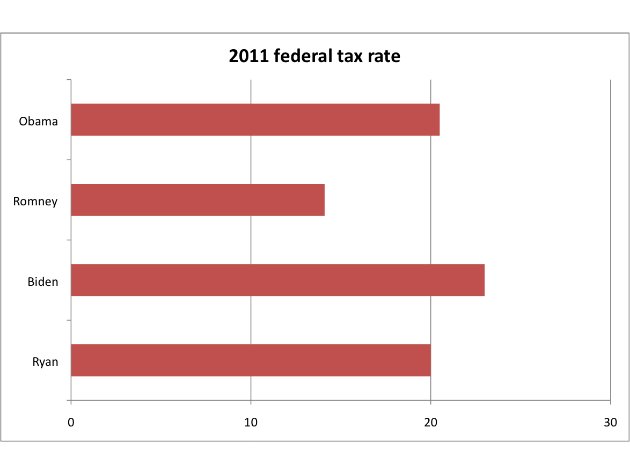
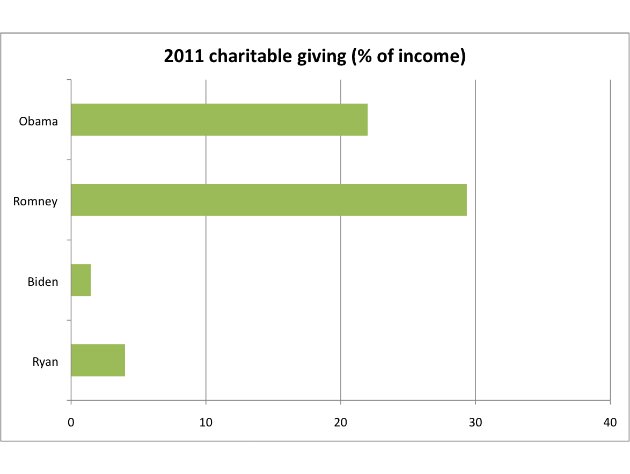
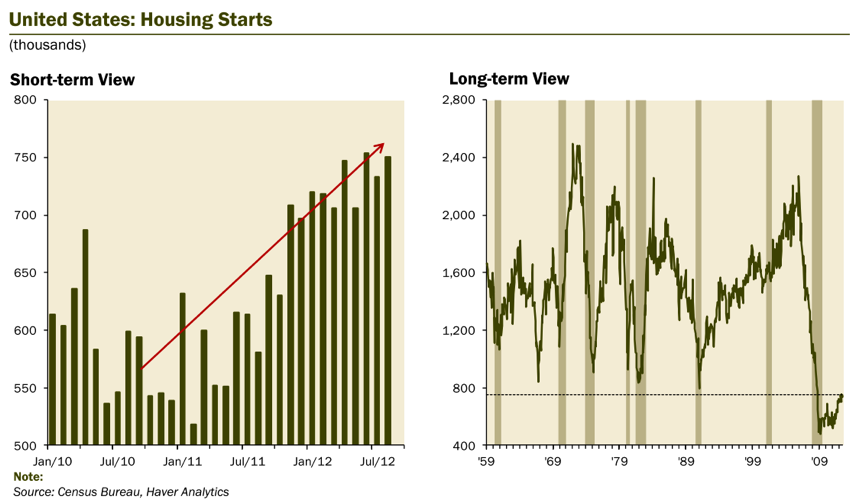
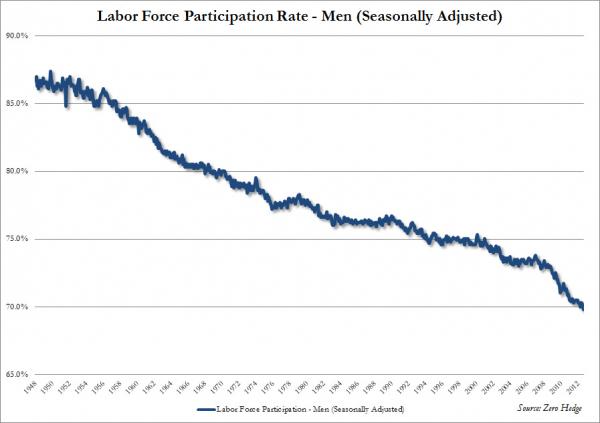
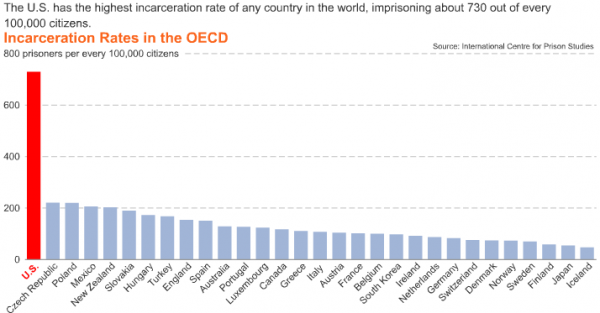
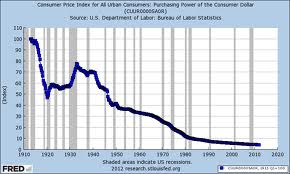
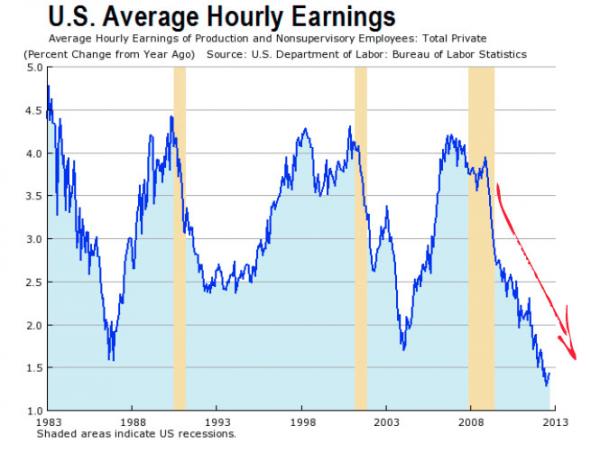
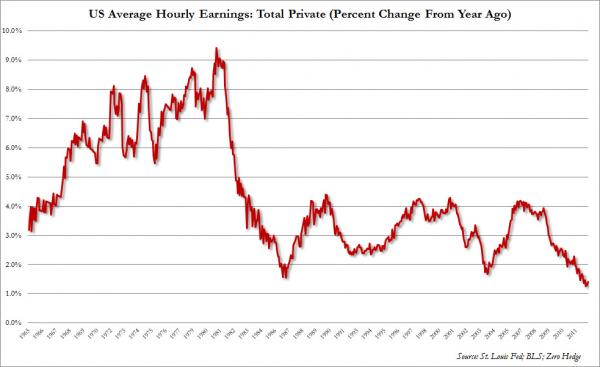
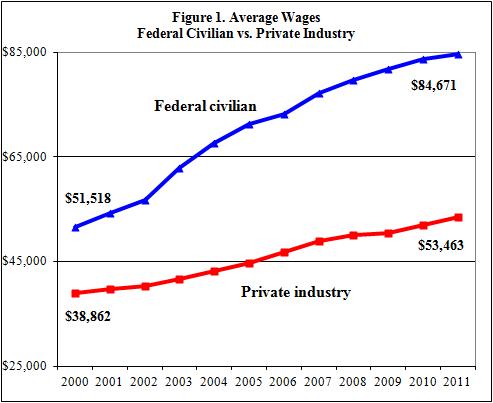
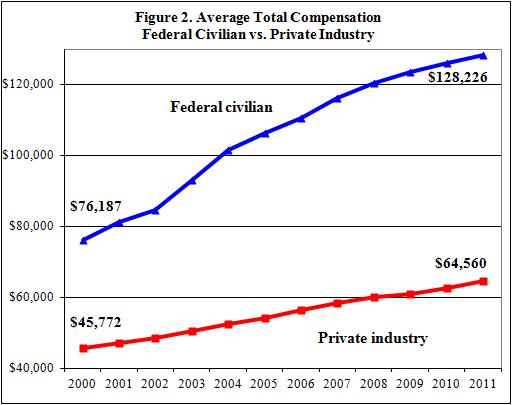
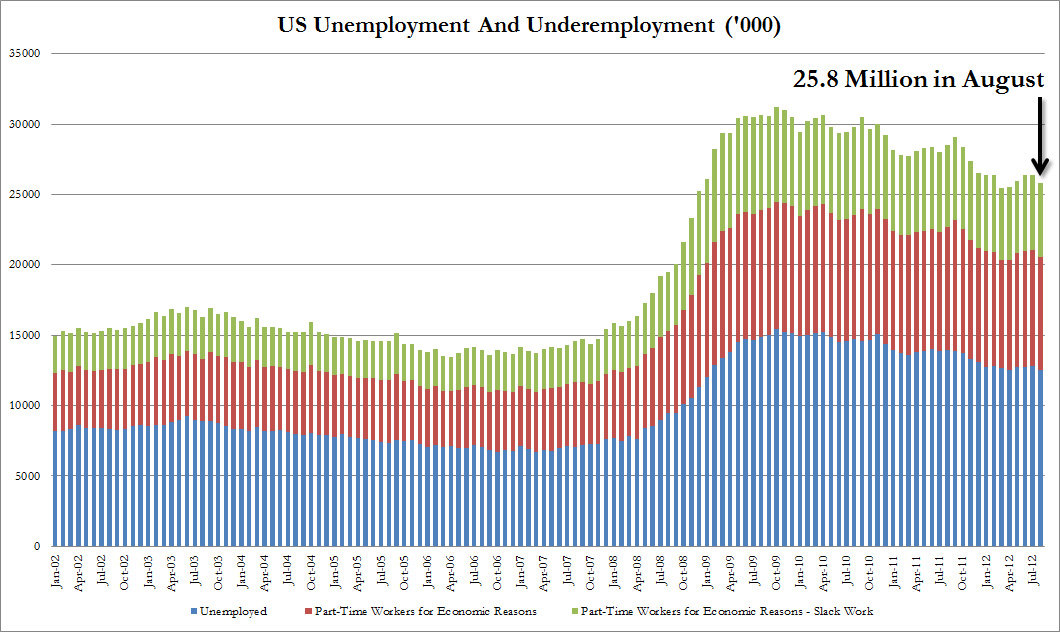
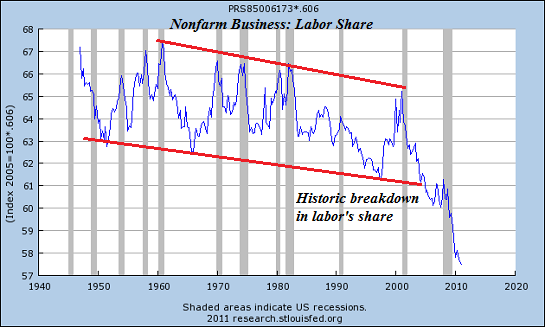
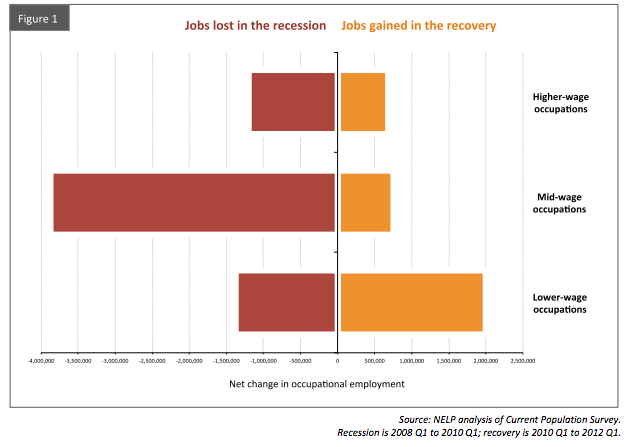
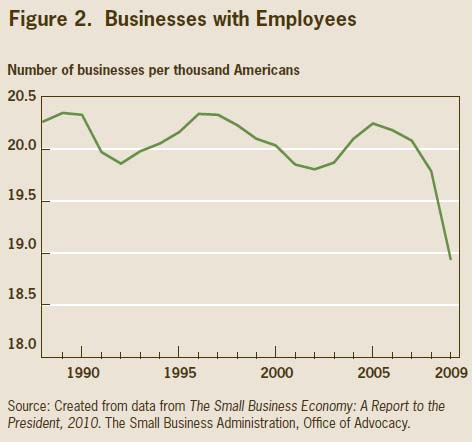
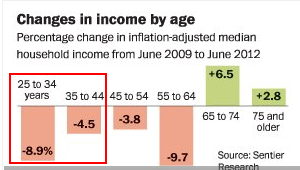
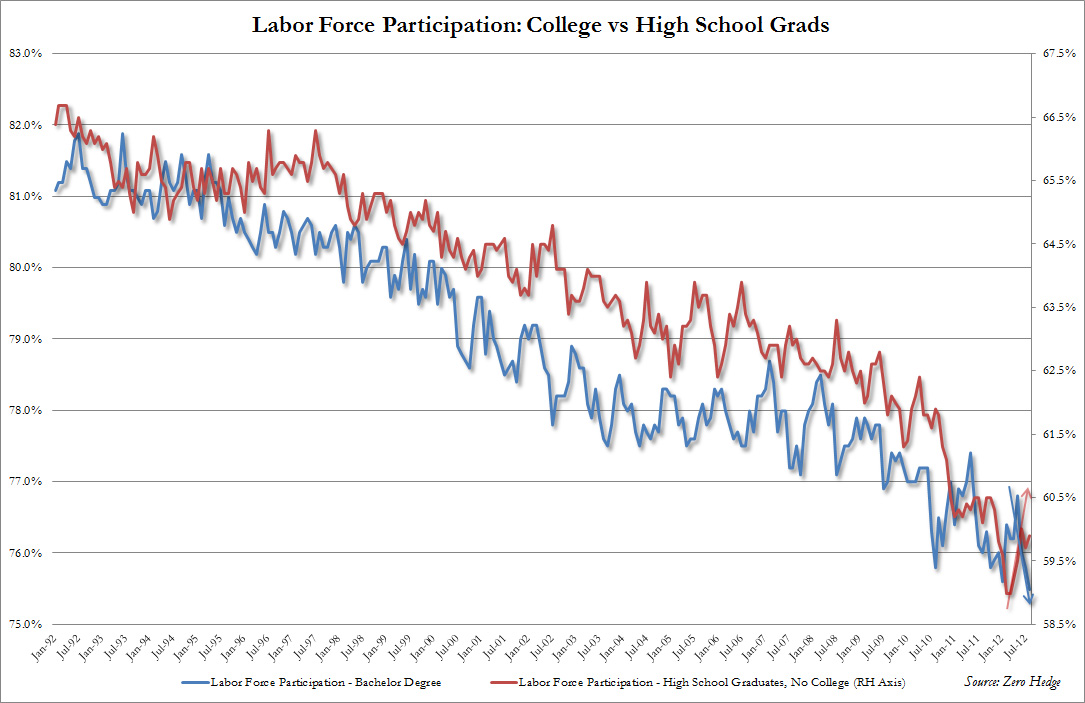
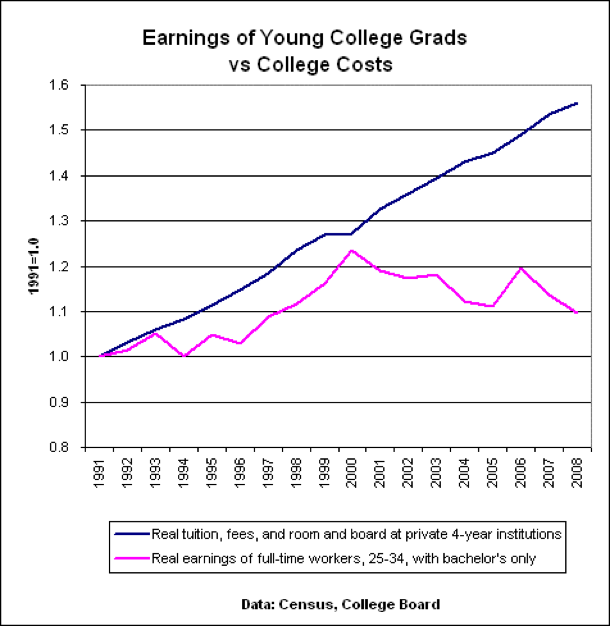
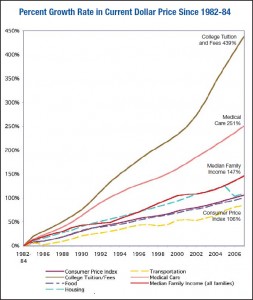
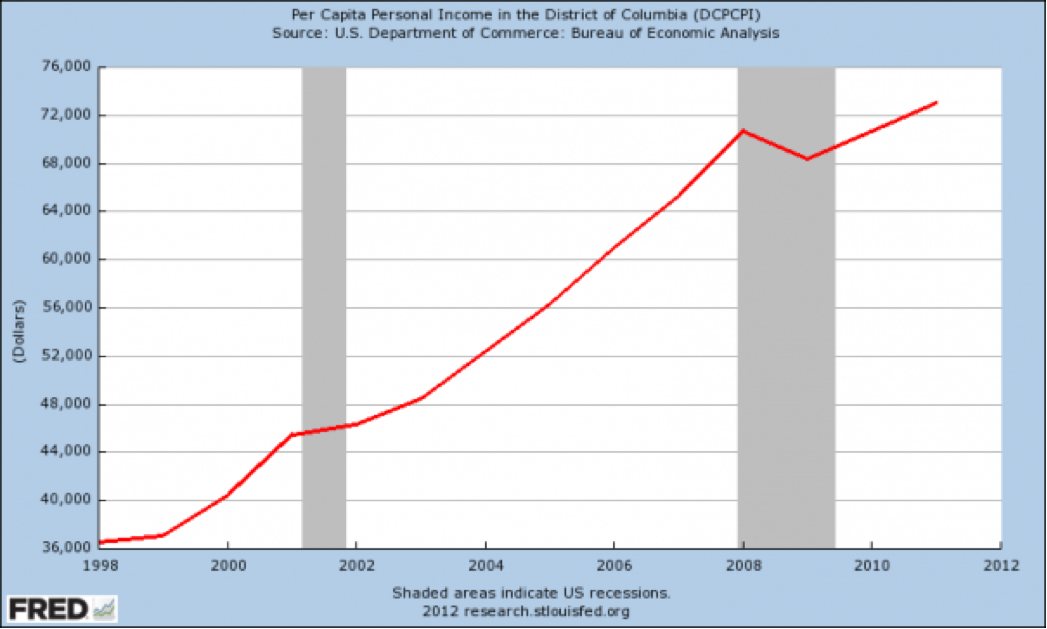
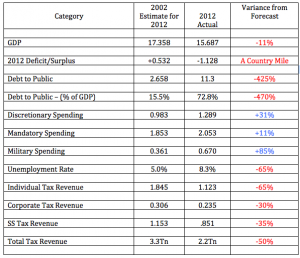
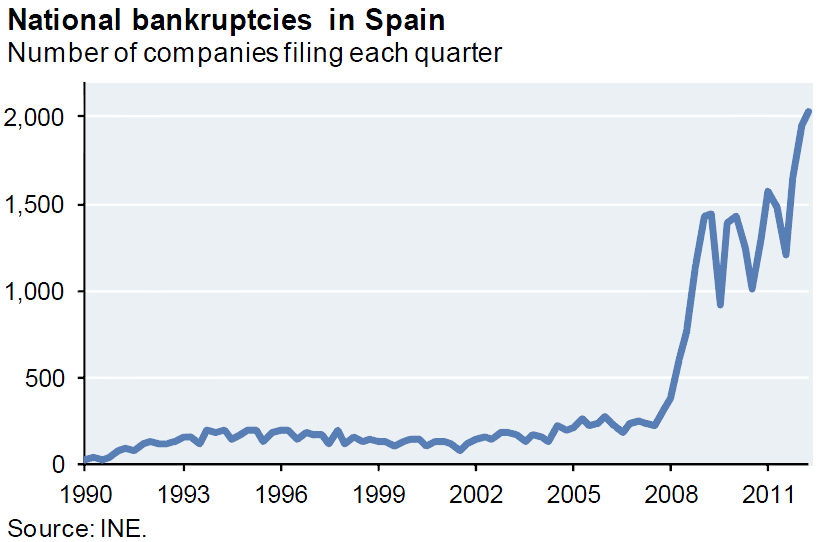
Here's some charts to think about the next time someone, most likely the President of The United States starts yammering about what a fine job he's done in reducing the rate of unemployment.


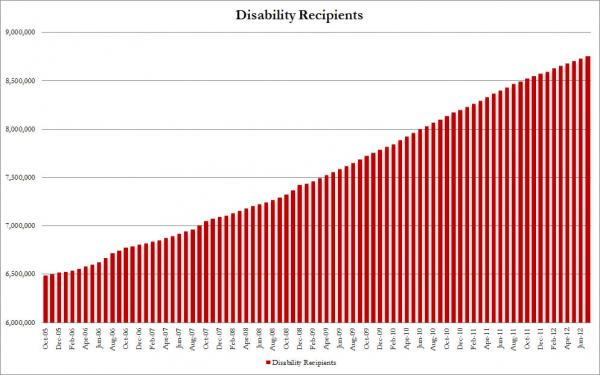
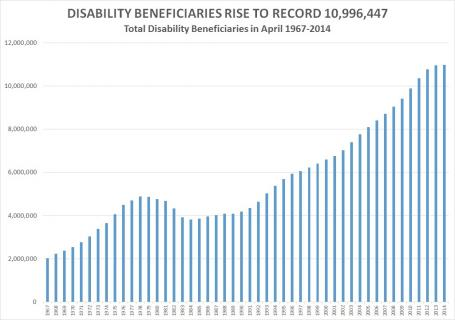
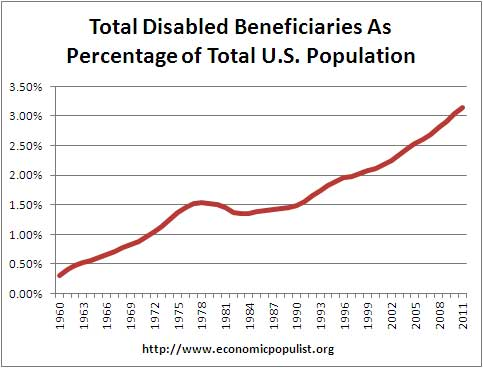
The chart below was taken from an NPR piece titled "Unfit For WorK the startling rise of disability in America". Click anywhere on the chart to pull up their presentation.


Maybe we'll look into U6 next week. I dunno. You could go look into it yourself if you want. Then tell me about it.


Figures Don't Lie. But Then Again, Liars Will Figure.

Submitted by Roanman on Sun, 08/17/2014 - 12:04


So, I’m sitting here in front of my screen fooling around on Linkedin instead of paying the bills, when I see that Pulse has recommended a piece penned by some guy in the investment business, titled American’s Sour Mood on the Economy Doesn’t Square with the Fact. 


Sigh!


I know this has been the chronic theme proffered by the professional shills appearing on your TV set morning, noon and night for some time now. I had been getting pretty good at ignoring them.


At first I was doing a pretty good job of ignoring this guy as well.


But finally ….. I succombed ….. 


So in order to rebut this guy, I start to pull together some updated versions of charts I have collected in the past, and in so doing, I stumble across a Quartz piece titled Seven Charts That Leave You No Choice But To Feel Optimistic About The US Economy, and just that quick …..


We begin.


As almost always, clicking on the charts will link you up to the piece from which they were taken.


The Headline Unemployment Rate is hovering just above 6%. 


Pasted Graphic 1.tiff


The formula for calculating the rate of unemployment is as follows; 


Unemployment Rate = Number of Unemployed / Total Labor Force.

Total Labor Force = Number of Employed People +  Number of Unemployed People.

An unemployed person for purposes of the above calculation is defined by the Bureau of Labor Statisics as follows: person who had no employment during the reference week, was available for work, except for temporary illness, and had made specific efforts to find employment some time during the 4 week-period ending with the reference week. Persons who were waiting to be recalled to a job from which they had been laid off need not have been looking for work to be classified as unemployed. 

So, people are counted as unemployed for purposes of calculating the rate of unemployment only if they are in the labor force.  And as such, unemployed workers who have quit seeking work are no longer counted for purposes of calculating the unemployment rate.

Got that?

As you can see below, labor force participation is in decline, if not freefall. 

Pasted Graphic 3.tiff


"What do it mean?"


If you have quit looking for work in favor of going on disability, you no longer count in the calculation.


And the total number of them that have gone on disability is going nowhere but up.


People who have gone on disability are for the most part not looking for work and thus counted as part of the labor force.


Fewer people in the labor force means ..... lower unemployment for purposes of calculating the headline number.


Pasted Graphic 6.tiff  


  Pasted Graphic 16.tif


Pasted Graphic 18.tiff


A significant percentage of the improvement in the rate of unemployment is directly attributable to the increase in "disabled" Americans.


Maybe there are more people on disability because we now provide help to people with honest disabilities that we have overlooked or ignored before.


But it strikes me that there might be more to it than just that.


Pasted Graphic 36.tiff


In case you were wondering how the unemployed are able to afford eating?


Pasted Graphic 9.tiff


Nope, that's old news.  


Food lines are passe' as they are very bad for the fiction that all is well with the economy.


Our modern food lines are much improved as they are far less obvious to the naked eye.


Pasted Graphic 7.tiff


But wait a minute. What about all those jobs the Obama Administration has created?


Pasted Graphic 10.tiff


I'm not impressed yet.


Mostly because ...


Pasted Graphic 11.tiff


But why so few full time jobs and so many part time jobs?


Pasted Graphic 14.tiff


To be crude about it, it's mostly because part time workers are cheaper, and sales suck.


But, there is some good news, car sales are back.


Pasted Graphic 19.tiff


Except .....


Car sales as reported in the press tend to be wholesale numbers.


Dealer inventories are also up dramatically.


GM channel stuffing.jpg


GM isn’t alone when it comes to this issue, as unsold inventory abounds all over the world regardless of manufacturer.

Definitely click on the photo below for a pretty quick, little piece on automobile manufacturers channel stuffing their supply system.


Pasted Graphic 23.tiff


Pasted Graphic 24.tif   Pasted Graphic 25.tiff


Oh well, that’s good news for me as I have to buy a car for a boy soon.


I’m thinking there should be some good deals on cars this fall.


Anyway, stocks are on fire, business must be good.


   Pasted Graphic 28.tiff


Except, the balance sheet of the Federal Reserve Bank has expanded nearly dollar for dollar with the increased value of the S&P 500.


Pasted Graphic 29.tiff


As has margin debt for NYSE member firms.


Pasted Graphic 30.tiff


And …


Pasted Graphic 31.tif


Well, it doesn’t take a rocket surgeon to figure this one out.


Corporate management is adding debt in order to buyback shares and in so doing are driving the surge in the stock market.


“But why would they do that?” You might well ask.


Management is compensated for increasing market cap rather than for running a profitable entity. 


All you need to know about “Corporate America” in one chart.


Pasted Graphic 34.tiff


Oh, and by the way, CEOs now earn on average, from 273 to 331 times the average worker’s pay depending on how you calculate stuff.


Pasted Graphic 35.tiff


Form your own opinion.


I got mine.


Gotta scoot.


More charts and stuff

Submitted by Roanman on Wed, 10/17/2012 - 07:59


On account of us having barely even put a dent in the pile of stuff we've collected recently, here's a little more.

Since it's the morning after the second debate between Barack Obama and Mitt Romney in their contest to determine the next President of the United States, and the subject of "taxing the rich" is bound to have come up, let's start with tax rates.

Romney's 2011 tax rate was significantly lower at about 13.6% than was Obama's at about 21%.

Romney's giving exceeds that of Obama by a score of 29% to 24%. 

At the risk of being accused of beating a dead horse, we think everybody should be paying the same rate after a substantial personal deduction and that charitable giving should only be an issue if some selfish little turd who gives next to nothing out of his personal account happens to be running for the office of Vice President.


We know this and are positive that you know it as well, but it is certainly worth repeating. 

Charts like statistics can be fudged, as is pointed out in these two views of America's 'housing recovery.


We posted these two a while back.

Both employment/population and the labor force participation rate of men are in serious decline.


Not to worry though as our government with money provided by the American people supplies many, many, many of our poorest and less fortunate souls with food, clothing and shelter in abundance.


The following depiction accurately ... we think ... conveys how we determine who it is that needs the most help providing for their own living arrangements.

Fair is fair.


And many Americans need this help as large percentages of the American people have less than a $100 cash reserve for emergencies.


Part of the problem might just be that the value of the unit in which people are getting paid, the dollar, declines in value year after year after year after year after ......

Yeah, yeah you've seen this one before.


While the rate of change in average hourly earnings is also in decline.


I believe that we have mentioned that those scalawags over there at the government are living large.


We're guessing that not one word of any of this with the exception of that "tax the rich" thing was mentioned last night.

Out of time ..... gotta scoot.


To quote former Obama Administration, Chairman of the Council of Economic Advisors, Austan Goolsby

Submitted by Roanman on Wed, 10/10/2012 - 13:28

Charts upon charts upon charts upon ..... and a couple cartoons.

Submitted by Roanman on Fri, 09/14/2012 - 18:46


In 1977, Congress amended The Federal Reserve Act, stating the monetary policy objectives of the Federal Reserve to be as follows,

"The Board of Governors of the Federal Reserve System and the Federal Open Market Committee shall maintain long run growth of the monetary and credit aggregates commensurate with the economy's long run potential to increase production, so as to promote effectively the goals of maximum employment, stable prices and moderate long-term interest rates."

The notion that the Fed is tasked with promoting maximum employment and stable prices is what is frequently termed the Fed's "Dual Mandate".

Having failed miserably throughout the entirety of it's charter (1913) to maintain stable prices, as the decline in the value of the dollar equals increased prices for everything other than a dollar.


The purchasing power of the dollar 1792 - present, dotted lines signify those periods when convertability to gold was/is suspended.


The Fed decided this week that they better address their almost equal fail with regards to maintaining full employment, on account of the following.  

Things are not going swimmingly in Detroit.


Purchasing managers all over the world are backing off ... numbers below fifty for the Purchasing Managers Index signify economic contraction.


Here's where Clint Eastwood gets his number for unemployment.


The employment to population ratio pretty much sucks.

Although it may be forming a bottom ..... one hopes.


What's up with this?

That's the new economy at work ..... so to speak.

Service jobs are what we do around here now days.


1948 to the present.


Dirty manufacturing is out of favor, construction is smashed.

Look closely here, these are total numbers not percentages.

Adjust this horror story for population growth and think it through.

In our opinion, you are looking at the single most profound unintended consequence of kneejerk green/liberal/progressive othodoxy of them all.


As a result, Labor's share of GDP is at historic lows as all those new bartender jobs just don't pay.


It gets worse if indeed small business is the engine of job creation.


This next one suprised us as we would have guessed the suffering extended across all age groups.


College just may not be that ticket to a better life.


We can't find the piece that defined the word young in this chart.


The most common complaint with regards to inflation ... at least among those that that we hear ... has to do with the increasing price of medical care.

The price inflation of a college education blows medical inflations's doors off.

As a result, total student loans exceed credit card debt for the first time in history.

As an aside, student loans can't be extinguished in bankcruptcy since the Consumer Bankruptcy Reform Act of 1998.


Not to worry, those scamps on Wall Street and in Washington are getting theirs.


Speaking of Washington, the next time one of those highly paid professionals at the Congressional Budget Office whips out a projection in your vicinity, just reach out and slap that bastard.


Speaking of bankruptcy.

Coming to a country near you?


Evidently the cartoonist here is not crazy about economist Paul Krugman.


On a completely different subject, from John Cole.


The silent job killer: Our unemployment system

Submitted by Roanman on Thu, 07/19/2012 - 12:35


From CNN Money who has been on a roll lately.

As always click on the photo below in order to link up to the entire piece.

Since we're on the subject, here's a three minute vid also from CNN Money on youth unemployment in America.


The silent job killer: Our unemployment system

By Nina Easton, senior editor-at-large  July 19, 2012: 9:56 AM ET

FORTUNE -- Hemingway Apparel, located in a rural former cotton town a hundred miles east of South Carolina's capitol, should be the kind of small business that government nurtures. In a county where the unemployment rate hovers near 12%, the factory employs low-skilled workers who don't have a lot of options.

Hemingway barely survived the drift of apparel production overseas. Today, company owner Jack L. Marsh benefits from the "Made in America" determination of top customer Angela Newnam.  The Harvard Business School grad and former McKinsey consultant also happens to be a daughter of the Carolina textile mills who is putting her company, Knockout Panties, behind her stubborn belief in American manufacturing.

The Marsh-Newnam partnership has all the makings of a grassroots business story that -- stitched with thousands of others -- could aid an American jobs revival. Except for one thing: Marsh isn't hiring. He's being killed by unemployment taxes that are on their way to quadrupling since 2009. When new business comes calling, Marsh says, "I have to ask myself if there's another way to meet production needs without adding employees.'' He would rather pay overtime than shell out a per-worker tax of $900 (up from $270 three years ago) that is slated to rise to about $1,100 in 2014.


Overpaid unemployment benefits top $14 billion

Submitted by Roanman on Mon, 07/09/2012 - 06:42


From CNN Money.

Overpaid unemployment benefits top $14 billion

NEW YORK (CNNMoney) -- Don't spend that unemployment check too fast. The government might ask you to pay it back.

Overpayments are a rampant problem in the unemployment insurance system. The federal government and states overpaid an estimated $14 billion in benefits in fiscal 2011, or roughly 11% of all the jobless benefits paid out.

Of the states, Indiana was the worst offender, making more improper payments than it did correct ones.

Now, the U.S. Department of Labor and the states are in the midst of a massive effort to try to recoup some of their lost funds and avoid future overpayments.

Where does the money go?

The vast majority of unemployment benefits do go to people in need. In 2010 alone they helped keep 3.2 million Americans out of poverty, according to the Census Bureau.

But of the overpaid funds, most end up in the hands of three types of people: Those who aren't actively searching for a job, those who were fired or quit voluntarily, and those who continue to file claims even though they've returned to work. Any of those circumstances would make a person ineligible for benefits.

The overpayment typically results from an administrative error made either by the government, the employer, the worker or a combination of the three. ...

... In fiscal 2011, there were roughly 2,700 convictions for fraud related to unemployment insurance.


Or roughly 2,700 more convictions than were effected for fraud related to the mortgage debacle and the financial crisis.


US Unemployment by County

Submitted by Roanman on Mon, 04/23/2012 - 15:11


From the Bureau of Labor Statistics via Econobrowser.

The comments are at least as interesting as the chart itself.

Click on the map below for the entire piece which also features some charting from Calculated Risk.

I'll be honest here and tell you that nobody around here believes that the national unemployment rate is 8.8%, mostly because all of us are reading The Burning Platform.


Fewer young adults hold jobs than ever before

Submitted by Roanman on Thu, 02/09/2012 - 06:51


From CNN Money here's a short but revealing piece.


Fewer young adults hold jobs than ever before.

 February 9, 2012: 5:30 AM ET


The share of young adults with jobs has hit its lowest level since the government started keeping records just after World War II.

By the end of 2011, only 54.3% of those between the ages of 18 and 24 were employed, according to a Pew Research Center report released Thursday. And the gap in employment between the young and all working-age adults is roughly 15 percentage points -- the widest on record.


Sort of makes that 8.3% unemployment figure seem ..... what is the word I'm seeking here ..... fabricated?


Pages

Subscribe to RSS - Unemployment